Cap table and dilution simulator for founders
Add your co-founders and employees, set an option pool target and a seed round, and see who owns what today, after the pool top-up and after the investment. Everything runs in your browser.
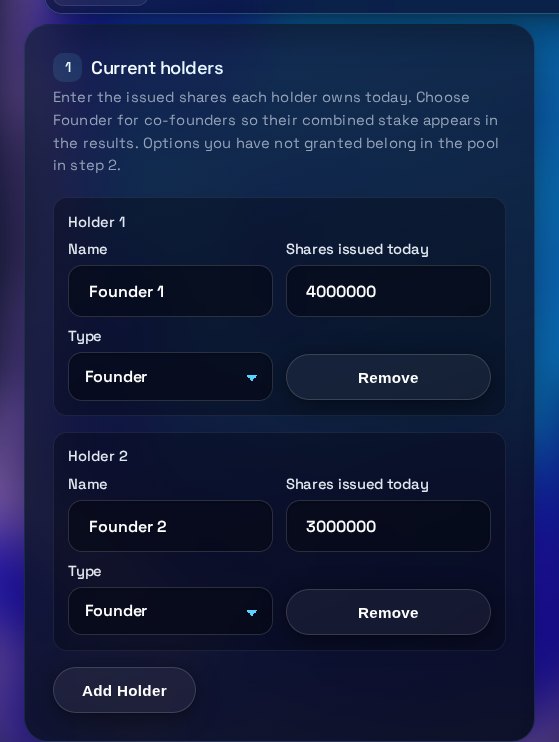
Showing an example: two founders, a 10% option pool and a $2,000,000 seed round at an $8,000,000 pre-money valuation. Change any field to model your own round.
Current holders
Enter the issued shares each holder owns today. Choose Founder for co-founders so their combined stake appears in the results. Options you have not granted belong in the pool in step 2.
Option pool and seed round
Set the pool target, the amount raised and the valuation before the money arrives. Each slider has an exact number box beside it.
The new pool, sized as a share of the company after the investment.
The pool is created before the round, so the top-up is counted in the pre-money valuation. This is the standard pre-money option pool shuffle, and the new investor is not diluted by the top-up. The model assumes there is no existing pool yet.
Ownership at each stage
Bars show the split at each stage. The table below gives the exact figures.
Today
After the pool top-up, before the investor
After the seed round
Before and after, holder by holder
On a phone, swipe the table sideways to see every column.
How to use the Cap Table & Dilution Simulator
Work through the sections below in order. Each one explains an input or a result, and the last one says when to bring in a lawyer or accountant.
What each input means
Current holders are the issued shares each person or entity owns today. Mark co-founders as Founder so their combined stake is shown. The option pool target is the share of the company, after the investment, that you want reserved for future option grants. The amount raised is the cash the investor puts in. The pre-money valuation is what the company is worth before that cash arrives. The tool counts the new pool inside the pre-money, which is how seed investors usually ask for it.
How to read the results
The price per share is the pre-money valuation divided by all pre-money fully diluted shares, including the new pool. The investor receives the amount raised divided by that price. The post-money valuation is the pre-money plus the amount raised. The table shows each holder's percentage today, after the pool top-up and after the round. Check that each stage adds to 100 percent, which the badge confirms.
Common mistakes
Leaving out holders, or entering the same shares twice. Treating a post-money valuation as the pre-money figure, which changes the price per share. Forgetting that a larger pool dilutes existing founders but not the investor. Copying the output into a term sheet without checking the share count. Modelling an existing unallocated pool as if it were new, because this tool does not net off an existing pool.
When to talk to a lawyer or accountant
Speak with a startup lawyer before you sign a term sheet or issue shares. Share classes, liquidation preferences, anti-dilution clauses and vesting change who is paid and when, and this calculator ignores them. An accountant can advise on the tax treatment of option grants and on how the company values its shares. Use these figures as a starting point, and ask them to confirm the share count and price.
Three steps
The short version, if you want to get straight to your answer.
- Add the holders. List each co-founder and employee with the issued shares they hold today. Mark co-founders as Founder to get their combined stake.
- Set the round. Choose the option pool target, the amount raised and the pre-money valuation. Sliders and exact number boxes stay in sync.
- Read each stage. Compare every holder's percent today, after the pool top-up and after the round, with the price per share and the shares issued to the investor.
Tips for accurate results
Small input choices change the answer. These are the ones that matter most.
- Enter issued shares only. Granted options are not shares yet, so add them as a holder row if you want them in the fully diluted count.
- Ask the investor whether the pool sits in the pre-money. Moving it to the post-money changes the price per share and the founders' stake.
- Compare the founders' percent after the round at two different pool targets. The gap shows what the pool costs you.
- Use the exact number boxes once you have a term sheet, because sliders move in fixed steps.
- If the check badge does not say passed, an input is wrong. Do not use the output until it does.
Questions about the Cap Table & Dilution Simulator
Answers to the questions people ask most often.
What is an option pool shuffle?
An option pool shuffle is when the new option pool is created before the investment and counted in the pre-money valuation. The top-up then dilutes existing holders, not the new investor. This tool sizes the pool so it equals your target percent of the post-money fully diluted shares.
Does this include existing options?
Granted options are not modelled separately. If you want them counted, add them as a holder row using the number of option shares, because they add to the fully diluted total. The tool assumes there is no existing unallocated pool, so its target is the size of the new pool. Strike prices and vesting are not included.
How is the price per share calculated?
Price per share is the pre-money valuation divided by the pre-money fully diluted shares, which include the new option pool. The investor receives the amount raised divided by that price.
Does this replace legal or tax advice?
No. It is a planning estimate. Share classes, liquidation preferences, vesting, anti-dilution terms and option strike prices are not modelled. Check the figures with your lawyer and accountant before you sign anything.
Is my cap table uploaded anywhere?
No. The calculations run in your browser, and nothing you enter is sent to TRIZAN.
More free tools
Other tools from TRIZAN you might use next.
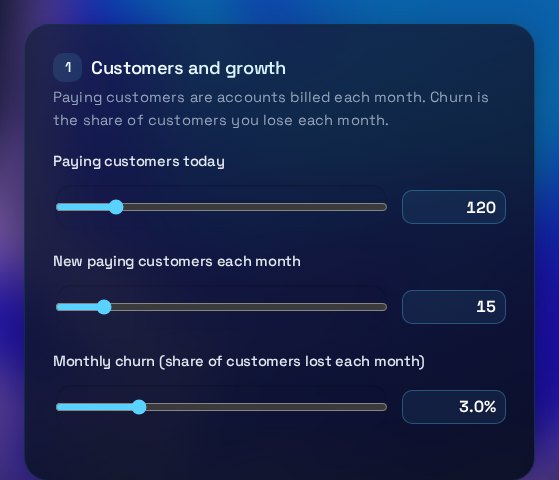 Founders and financeSaaS Pricing & Margin PlaygroundTest tier prices, churn and costs to see MRR, ARR, gross margin, lifetime value and a 12-month forecast.Open the tool
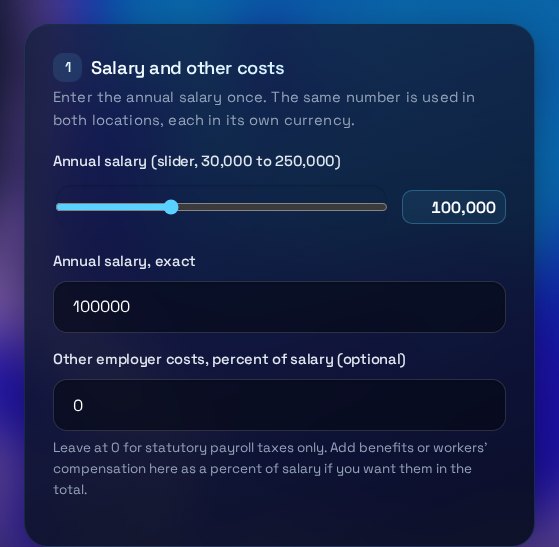 Founders and financeUS vs Canada Hiring Cost CalculatorEstimate employer payroll taxes and full cash cost for a salary in US states or Canadian provinces.Open the tool